|
Smart Protocol Analyzer
Smart Protocol Analyzer test set translates protocols into plain English. It can decode industrial protocols like:
- Modbus RTU
- Modbus ASCII
- Modbus TCP
- Fisher ROC
|
- DNP
- DNP/TCP
- Bristol Babcock BSAP
- Teladine Binary
|
and any other SCADA industrial protocol which is transmitted over serial link (RS485, RS422, RS232), dial up modem, radio modem, TCP/IP, UDP/IP, PPP and CDPD.
Our Analyzer also captures ethernet traffic directly from the LAN as well as dial-up PPP connections and supports socket based terminal server monitoring. The Analyzer's serial monitor, captures serial port traffic transparently, non-intrusively, without requiring any special setup. In addition, serial monitoring can also be performed by using special sniffer adapter/cables. Once the software is installed, you are ready to capture your serial or ethernet data in real time.
Smart PA is rich in features and is easy to setup and use.
Some key features offered in our Smart Protocol Analyzer:
SmartPA SQL
SmartPA SQL is an optional feature of Smart Protocol Analyzer that makes the process of finding, marking, printing and saving target packets, even among a million packets, extremely fast and extremely simple. There are many solutions that will allow you to capture serial and network SCADA traffic and even decode it, but none of them offer an easy way to find packets based on engineering values except by tedious visual inspection of packets. SmartPA SQL is the solution if you value your eye health and your time. SmartPA SQL converts raw hex bytes from real time serial/network communication or saved communication logs (including PCAP files) into English and then converts it into a pseudo SQL fast memory table with pseudo rows and pseudo variable columns that you can query using SQL Select statement where the column names are SCADA protocol fields like MODBUS register 4001 or DNP point 30.2.0, 2.2.0.Time for timestamp or 2.2.0.Status for status flags. SmartPA SQL is our own implementation of SQL SELECT parser and it does not depend or use any SQL server. SmartPA SQL uses a subset of standard SQL SELECT syntax and operators with some SmartPA SQL only functions (e.g., change(), dnptime(), wintime(), unixtime(), bits() etc.) designed for SCADA specific use. If you know basic SQL Select statement, know what a MODBUS register is or what DNP analog and digital points are, then you already know how to use SmartPA SQL. SmartPA SQL supports the following SQL SELECT syntax
1. SELECT * FROM P WHERE EXPRESSION1 [AND/OR/BETWEEN/NOT/IN/LIKE/IS NULL/IS NOT NULL] [EXPRESSION2], ...
2. SELECT `column1` [AS var1] , `column2` [AS var2], expression1 [AS var3], ... [INTO OUTFILE filename] FROM P WHERE <EXPRESSION1> [AND/OR/BETWEEN/NOT/IN/LIKE/IS NULL/IS NOT NULL] [EXPRESSION2], ...
Fields inside [] are optional
SmartPA SQL columns are protocol based e.g., `3001`, `4001`, `8001`, `30001`, `10001`, `40001`, `400001` are some of the column names for MODBUS and `1.2.0`, `2.2.0`, `30.2.0`, `30.4.0`, `40.1.0`, `12.1.0`, `12.2.0`, `50.1.0` etc., are some of the column names for DNP
Unlike SQL servers, you do not have to create any SQL table, or define any SQL columns. SmartPA does that for you automatically using a pseudo memory table 'P' and pseudo memory variable columns based on the SCADA protocol.
Expression can be a combination of user supplied constant values, variables from protocol packets (SQL columns), operators such as =,>,<,>=,<=,<>,!=,%,+,-,/,*,^,,AND,OR,BETWEEN,NOT,IN, LIKE, IS NULL, IS NOT NULL,string concat, string length, string advanced pattern matching using regular expressions,abs(x), sin(x), cos(x), tan(x), asin(x), acos(x), atan(x), log(x), log10(x), ceil(x), floor(x), sinh(x), cosh(x), tanh(x), deg(x), rad(x), min(a,b,c,...), max(a,b,c,...), change(`col1`, `col2`, ...), bits(x, starting bit offset, number of bits), dnptime('mm/dd/yyyy hh:mm:ss.msec'), wintime('mm/dd/yyyy hh:mm:ss.msec'), unixtime('mm/dd/yyyy hh:mm:ss')
dnptime(), wintime() and unixtime() are overloaded functions and they can accept a 64 bit integer (32 bit in case of unixtime()) value directly instead of string date time format. Therefore you can also use a user supplied 64 (or 32) bit time value or DNP Time object as a parameter in dnptime() e.g. dnptime(1619148799250LL), dnptime(`2.2.0.Time`) or dnptime(`50.1.0`) etc.
Passing an empty string to dnptime(), wintime() or unixtime() returns the current time value as 64 bit (or 32 bit in case of unixtime()) integer. To get a date time formatted string instead of an integer simply call the function twice e.g. , dnptime('') returns current time as 64 bit dnptime and dnptime(dnptime('')) returns current time as mm/dd/yyyy hh:mm:ss.msec. This is equivalent to SELECT NOW() as used in SQL servers but offers a wider range of timestamps and up to 100 nanosecend accuracy which standard SQL servers do not offer.
wintime() returns windows FILETIME using same rules as dnptime(). unixtime() returns unix time in seconds since 01/01/1970 00:00:00
SmartPA SQL defines a special variable row which can be used in SELECT to print the current row number and is equivalent to ROW_NUMBER as used in SQL servers.
SmartPA SQL columns are MODBUS register names, function code, Msg Type, Msg Length, DNP Points, DNP variations, DNP Status flags, DNP Internal indication bits etc.
Syntax 1) is speed optimized. Use this syntax if you wish to find and mark packets only
Syntax 2) is for printing and optionally saving the query results as csv files. Use this syntax if you wish to find, mark, print and save register/DNP point value/status/flags etc., from packets. Since INTO can only have one target for SmartPA SQL i.e. the filename. Therefore INTO OUTFILE filename and INTO filename will do the same thing.
Here are some examples:
MODBUS
select * from p where `3001` > 1234;
select * from p where `30.*` > 1234;
above query select packets where any register that starts with 30 (3001, 3002, 30004 etc) has value > 1234
select * from p where `3001` = `3002`;
above query select packets where value of register 3001 is same as register 3002
select * from p where `3001` > 2*`3002`;
above query select packets where value of register 3001 is greater than twice the value of register 3002
select * from p where `40001` in (100,200,300,400);
select * from p where `40001` not in (100,200,300,400);
select * from p where `40001` in (100, 200, `40002`,`40003`);
above query select packets where value of register 40001 is in a csv list of values which could be numbres, expression or even other MODBUS registers
SmartPA allows remapping of MODBUS register to match the profile of any device. Sample files can be modified using text editor to match the register mapping, byte ordering, data types and function code text to match any MODBUS device.
DNP
select * from p where `1.2.0`=1;
select * from p where `30.2.10` between 100 and 500;
select * from p where `30.2.10` like '500.*';
above query select packets where 30.2.10 has a value starting with 500
select * from p where `30.2.10` > `30.2.11`;
above query select packets where value of 30.2.10 is > than value of 30.2.11
select * from p where `32.1.4.On-line`=0
select * from p where `32.1.*.On-line`=0
select * from p where change(`32.1.4.On-line`)=1
above query select packets where value of 32.1.4.On-line changes
select * from p where change(`30.1.4`,`30.1.5`)=2
above query select packets where value of 30.1.4 and 30.1.5 changes together
select * from p where change(`30.1.4`,`30.1.5`)=1
above query select packets where value of either 30.1.4 or 30.1.5 changes
Some of the things you can do with SmartPA SQL
Find, mark, print and save packets in seconds using expressions, regular expressions, and engineering values based on user supplied constant values and/or variable register/DNP point values instead of matching raw hex bytes.
Find packets where a register or DNP point has a particular value
Find packets where a register or DNP point is between a range of values
Find packets by comparing value of one register with another register or value of a DNP point with another DNP point within the same packet
Find packets by comparing value in a set of values using SQL IN operator
Find packets where a particular register or DNP point is present using SQL NOT NULL operator.
Find packets by comparing mutiple expressions combined by using AND/OR SQL operators, where expressions can be user supplied values, MODBUS registers, DNP Points, Math functions, Math operators like *,/,+,-,power,log,sin and more.
Find packets where a particular bit of a register or status flag of a DNP point (Online, COMM Lost, Local/Remote forced, Over range, etc.) has a particular value
Find packets by using advanced pattern matching and regular expressions for column values as well as for column names. While other SQL servers do support regular expression for matching column values but none of them support regular expression for matching column names in the WHERE clause. This is a SmartPA SQL especial feature only. The only limitation is that regular expression as column names can be used with standard SQL operators in the WHERE clause but not as a parameter to functions. Therefore regular expression column name can be used in WHERE clause with operators =, <, >, >=, <=, BETWEEN, NOT BETWEEN, IN, NOT IN, LIKE, NOT LIKE, IS NULL, IS NOT NULL e.g.
1) WHERE `30.*` > 100
2) WHERE `2.2.*.Time` is NOT NULL
But not as parameters for functions e.g., change(`30.*`), bits(`300.*`,1,1), dnptime(`2.2.*.Time`) etc. Also note that any operator ,other than the listed operators, can not be combined with the column name to form an expression when using regular expression as the column name
Find packets when you don't know an exact value by using pattern matching SQL LIKE operator e.g., select * from p where `3001` like '.*22.*' this query will find all packets where register 3001 has 22 as a part of it's value like 2200, 122, 1223, ...
Find packets when you don't know the exact register or DNP point number by using pattern matching in column names e.g., select * from p where `30.*`=100; this query will find all packets where a DNP point with any variation and any point number has a value equal to 100
Find packets when you neither know the exact register or DNP point number nor the exact value for that register e.g., select * from p where `30.*` like '55.*'; this query will find all packets where any DNP object 30 has a value that contains digits 55
Find packets when value of a register or DNP point changes e.g., select * from p where change(`30.2.1`)=1; this query will find all packets where value of 30.2.1 changes. Other SQL servers have no equivalent functions like change() and a very complex SQL query is required what SmartPA SQL can do using the SmartPA SQL only function change()
Find packets when value of several registers or DNP points change e.g., select * from p where change(`3001`,`3002`,`3003`)=3; this query will find all packets where value of registers 3001,3002 and 3003 change
Find packets when value of some registers or DNP points change e.g., select * from p where change(`30.2.0`,`30.2.1`,`30.2.2`)=1; this query will find all packets where value of any one of the listed DNP points change
Find min and max values of register or DNP points e.g. select `3001`,`3002` from p where `3001` is not null and `3002` is not null; this query will print values of register 3001 and 3002 as well as their min and max values
Find packets based on a bit value from a register or DNP point e.g. select * from p where bits(`3001`, 5, 2)=3; this query will find all packets where 2 bits of register 3001 starting at offset 5 are set. bits() is a SmartPA SQL only function
Find packets where one or more DNP Internal indication bits are set e.g., select * from p where `IIN.Device Trouble` = 1 or `IIN.Config Problem` = 1; this query will find all packets where Internal indication bit for Device Trouble or Config Problem is set
Find packets where DNP has event with timestamps between a range of timestamps e.g. select * from p where ui64(`2.2.0.Time`) between dnptime('03/01/2021 07:00:00.000') and dnptime('03/01/2021 08:00:00.000'); this query will find packets where 2.2.0 timestamp is between 03/01/2021 7:00 AM and 8:00 AM. Notice that timestamp accuracy can be upto 1 millisecond
Find and print packet number, timestamp and its min/max value from packets where DNP has event with timestamps between a range of timestamps e.g. select `packet`, dnptime(ui64(`2.2.0.Time`)) from p where ui64(`2.2.0.Time`) between dnptime('03/01/2021 07:00:00.000') and dnptime('03/01/2021 08:00:00.000'); this query will find packets where 2.2.0 timestamp is between 03/01/2021 7:00 AM and 8:00 AM. It will also print the packet number and Timestamp value and print the min/max of the Timestamp for 2.2.0
Find packets based on packet length, direction, capture time, MODBUS address, DNP address, Function code, RTU Time, RTU strings, RTU string length and much much more
Use persistent Query feature to mark and print packets as they arrive in real time.
Combine SQL with Hide marked packet feature to narrow down results repeatedly. SQL is executed for visibile packets only so you can essentially narrow down your results by combining SQL with Hide packets and by repeating the process.
Find packets using any of the above methods and save them into an Excel readable CSV file e.g., "SELECT `3001`, `3002` into C:\reg.csv from p where `3001` > `3002`;
You do not have to know or remember exact column names for DNP, MODBUS or other protocols as these are available to you using SmartPA's intellisense SQL editor as seen in the snapshots link below
Click here for SmartPA SQL snapshots
Protocol Analyzer Server
The Protocol Analyzer Server is your solution to transparently save selected or all serial port data, TCP/IP specific port traffic, UDP/IP specific port traffic with support for NIC Teaming to daily log files with log rotation and size management. Protocol Analyzer Server runs as a headless Windows service in the background and interacts with Windows serial and network device drivers to transparently capture both Serial and targetted TCP/UDP IP traffic without interfering or interacting with your SCADA Master software. You can later access those daily communication log files and open them with SmartPA to analyze, find, extract and save data using SmartPA SQL and visual filter tools. In addition you can access/monitor remote SCADA traffic through the Smart Protocol Analyzer right from your Desktop PC in realtime. As long as you are able to get on the company network, you can use the Smart Protocol Analyzer to access the Protocol Analyzer Server and monitor the communication traffic on the PC for troubleshooting. All of this can be done without any extra hardware setup. Contact us for a solution designed for your SCADA System.
 |
Multi-user support with remote access |
|
 |
|
Hundreds of users can simultaneously monitor serial or ethernet activity at a remote site or on the local computer. Using the protocol decoder they can view protocol packets in real time, and select a packet to view its information in detail.
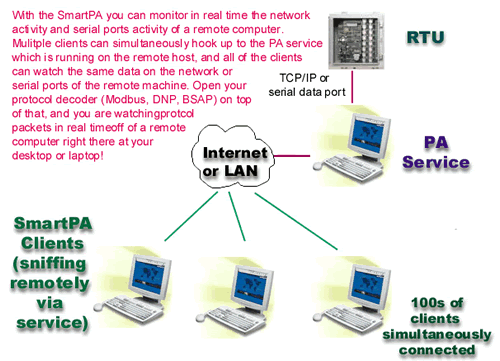
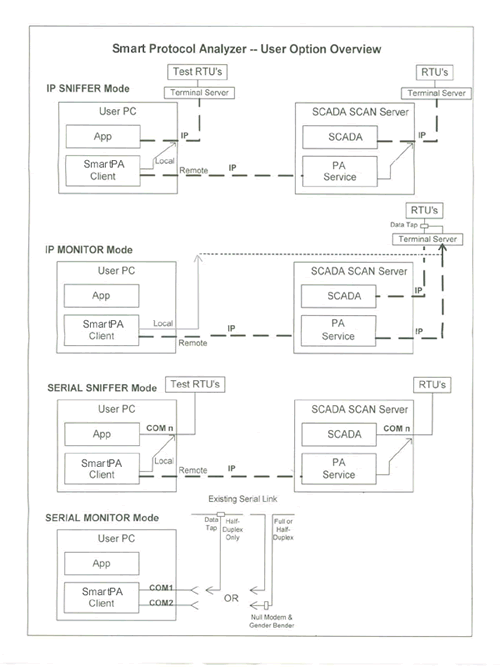
There are 4 kinds of operations that you can perform on the remote host using SmartPA as your local client:
- IP Sniffer
Sniff the network traffic on the remote machine. Select the IP address, the port, the protocol (TCP/UDP)
and the network card on the remote machine for the network communication you want to sniff and launch SmarPA. SmartPA will begin showing you network traffic on the remote host in real time, and open your protocol decoder on top of that to interpret the raw data as your protocol packets.
- IP Monitor (for Terminal Servers)
Some units have a data monitor port and they copy the data on the data port onto the monitor port. SmartPA can connect to the monitor port of the unit (via socket)and receive plus decode the protocol data either through local connection in stand alone mode, or remotely through the PA Service.
- Serial Sniffer
Sniff the serial ports traffic of the remote host. Just make sure PA service is running on the remote host, then connect using your SmartPA client, select the COM port of the remote host, and start sniffing the data of the remote host.
- Serial Monitor (Break out box feature)
This allows you to read open the COM port of the remote host, and directly read data that is flowing in. This feature can work with single serial port (half duplex traffic only) or with dual serial port (one to monitor rx and other for tx traffic).
...Back to top
 |
Transparently sniffing the Network or COM Ports |
|
 |
|
Smart PA transparently works without extra hardware or disruptions to your system
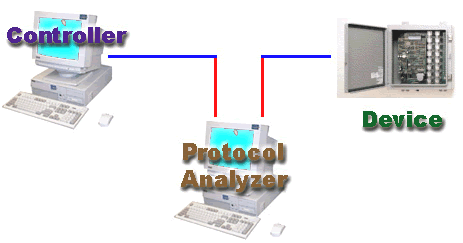
Traditionally similar serial port analyzers required you to hook up a special serial cable and an extra PC or extra hardware, the extra PC became the router and allowed you to view the serial data. Now with Smart PA, there is no need for an extra computer, or extra hardware, and no need to stop your existing software or restart your computer once Smart PA has been installed.
Other protocol analyzers require you to hook up a second PC between your device and the controller.
|
|
Smart PA runs on the same PC as your device controller.

|
Simply install the Smart PA, and start analyzing the traffic, no need to reconfigure your cables or stop your operations. We capture and decode transparently both serial and Ethernet traffic in real time.
Smart PA works non-intrusively, does not hinder with the operation of other programs , services and hardware that are already running there, and requires very minimal CPU.
...Back to top
 |
Capture Data from Multiple Ports simultaneously |
|
 |
|
Capture data from multiple ports simultaneously
Smart PA allows you to open multiple ports at the same time and monitor the communication without any hassle.
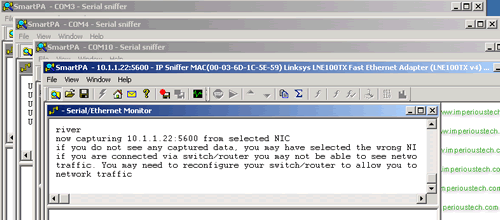
Just select a port, hit the start button, then select another port, and hit the start button again. This way you can open monitors for as many ports as you have.
Since Smart PA does not require extra hardware setup, it is hassle free and easy. With other protocol analyzers this would require multiple licenses, multiple cables, multiple hardware and your time. Not to mention, if anything goes wrong during the setup like loose cables or bad connections, then you end up troubleshooting the analyzer itself! Since most protocol analyzers are intrusive and disruptive, while you are doing the setup, your main system goes down. With Smart PA, trouble-shooting is as easy as starting the software, without taking down your main system.
...Back to top
...Back to top
Multiple users monitoring a single terminal server
Our terminal server feature allows muliple users to monitor a single data monitor port simultaneously. Terminal servers like XYPLEX allow only one connection at a time. Other analyzers when monitoring these connections will block other users from accessing this port. With Smart PA multi-user remote access mode, it is possible to have several users monitoring the same data port without blocking each other.
...Back to top
Here you can calculate the LRC and the CRC16 of the data in the 'Evaluation data' window. Make sure your 'Data Format' selection is the same as the type of data in your 'Evaluation data' window. For e.g. if the data in the 'Evaluation data' window is in binary hex form, then select 'Binary Hex' in the 'Data Format' drop down list box.
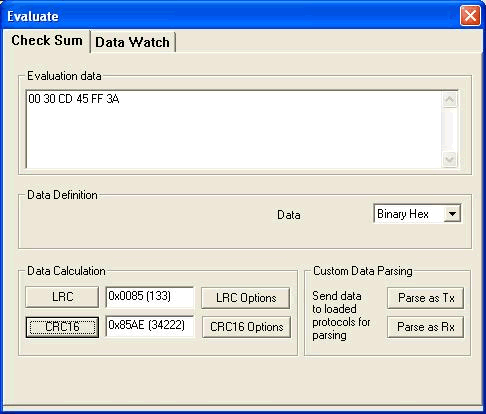
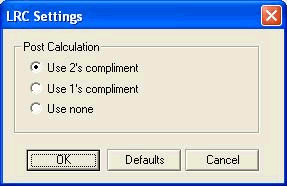
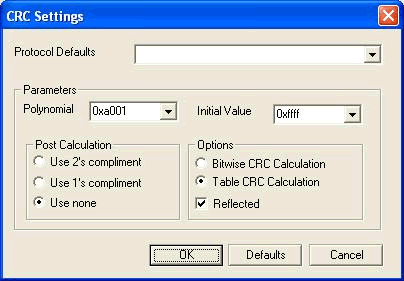
The LRC options and the CRC options let you select which specific CRC you want to use.
...Back to top
 |
Allowing you to Decode Data Interactively |
|
 |
|
Send your own raw data values interactively to the protocol decoder and let Smart PA parse it and show you the packets. Copy-paste illegible hex data into Smart PA, and get the protocol packets in human readable form.
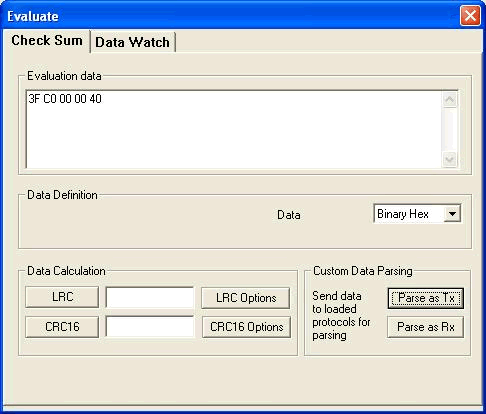
These hex bytes can be submitted to all the loaded protocols, the protocols will then parse your data and show useful information. The hex bytes can be transmitted as either 'Transmit Bytes' or as 'Receive Bytes'; the only difference is the direction of message flow. Usually you submit a request as 'Transmit' and a response as 'Receive'.
...Back to top
 |
Protocol Statistics on Captured Data |
|
 |
|
Protocol Statistics
Smart PA allows you to generate statistics specific to the protocol decoder you are using. Here is a snap-shot of DNP statistics.
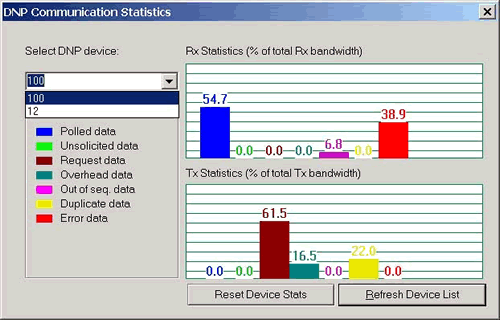
This dialog allows you to view statistics per device. You can check which category has more data, e.g. unsolicited, polled, etc. The legend shows for the corresponding bar graphs the category name in sequential order. Use this feature of Smart PA to optimize your bandwidth
...Back to top
 |
Filters to hide or unhide unwanted Protocol Data |
|
 |
|
Filters allow you to hide or un hide data from the Smart PA window. This useful feature helps you view just the data that interests you.
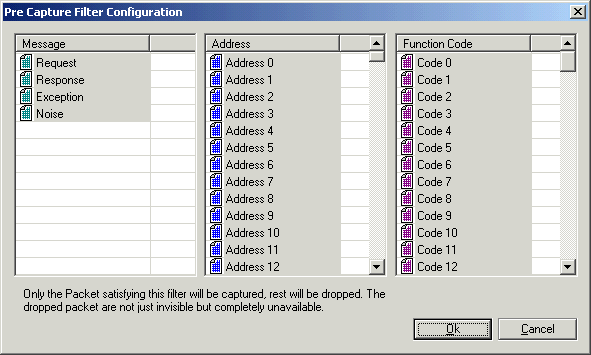
Pre Capture Filters
In this mode packets are filtered as they arrive, any packet satisfying the filter criteria will be displayed, the rest of them will be discarded. You will loose the discarded packets.
Use this if you are sure you won't need any packets that fail your filter.
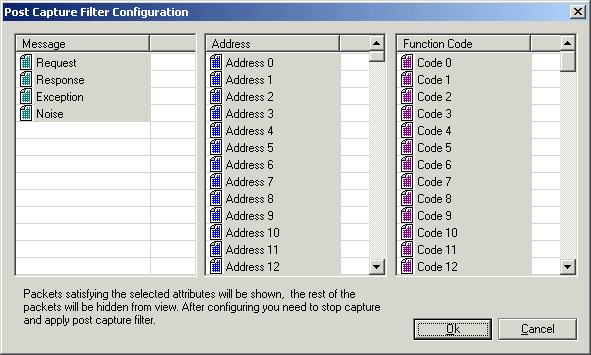
Post Capture Filters
For this mode, you have to turn off the capture or press the pause button.
Post capture filter is applied to the packets in the current capture data window. The packets that satisfy the filter will remain visible, the rest of them will be hidden. When you remove the post capture filter, the hidden packets will be shown again.
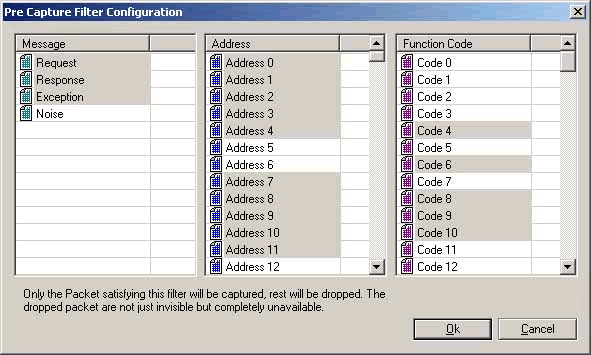
How to Configure a Filter
In this filter configuration dialog (see diagram below), only packets that are:
- request, response or exception packets
- address 0 - address 4 or address 7 - address 11
- code 4, code 6, or code 8 - code 10
will be allowed to pass the filter.
...Back to top
We do customization of our GUI (Graphics User Interface) to suit your needs. At ElPaso Energy Corp., they required a GUI with register contents displayed for the selected packet. This is the GUI we designed for ElPaso Energy Corp:
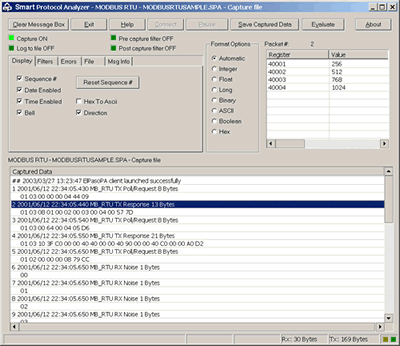
This is the original SmartPA GUI:
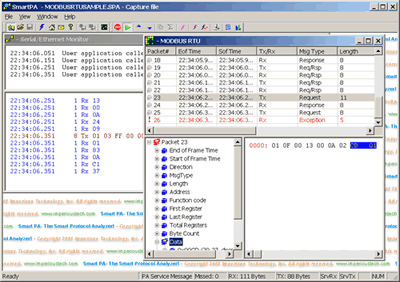
The Serial/Ethernet Monitor window at the back shows the raw packet bytes. The protocol decoder window in the front shows the data as protocol packets, after having being parsed. The tree view at the bottom allows you to select the packet field, and the corresponding bytes are shown high-lighted in the data pane.
...Back to top
|